Spectral analysis
Comparison of bass, alto and C flutes
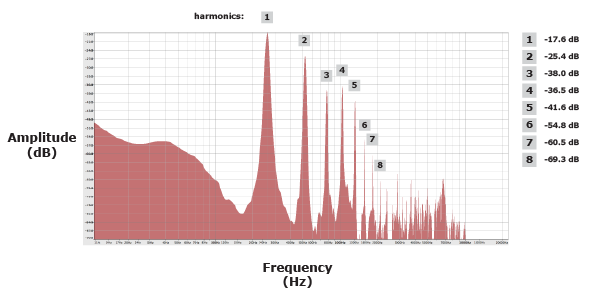
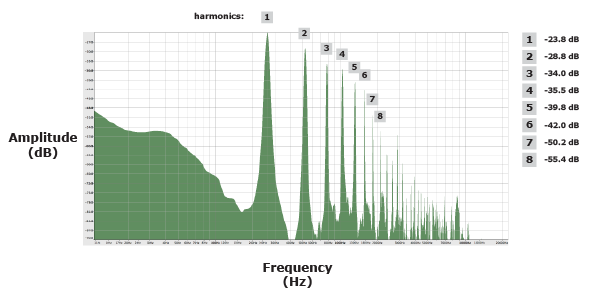
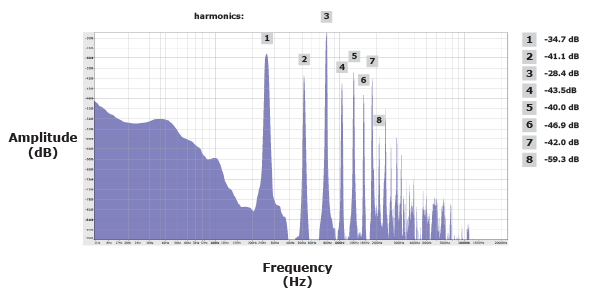
A spectral analysis of the sounding note c' (261.6 Hz) played mf on bass, alto and C flutes shows the differing volumes of harmonics 1-8 which make up the instruments' characteristic sounds.
Bass flute
Alto flute
C flute
| Harmonic | Bass flute | Alto flute | C flute |
|---|---|---|---|
| 1 | -17.6 | -23.8 | -34.7 |
| 2 | -25.4 | -28.8 | -41.1 |
| 3 | -38.0 | -34.0 | -28.4 |
| 4 | -36.5 | -35.5 | -43.5 |
| 5 | -41.6 | -39.8 | -40.0 |
| 6 | -54.8 | -42.0 | -46.9 |
| 7 | -60.5 | -50.2 | -42.0 |
| 8 | -69.3 | -55.4 | -59.3 |
Comparison of dynamics on alto flute
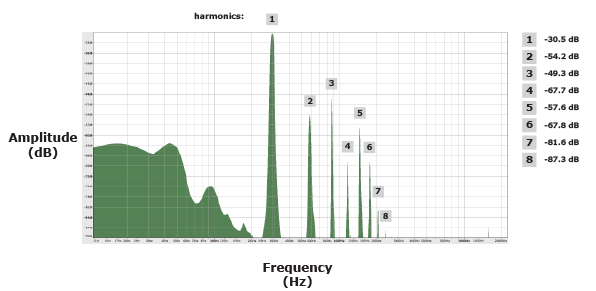
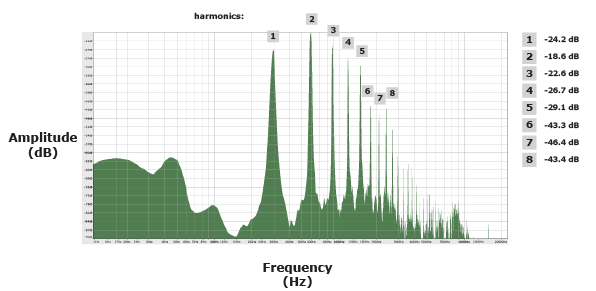
A spectral analysis of the written note a' (sounding d', 293.7 Hz) played ppp and fff on the Kingma System alto flute shows how the harmonic content of the instrument's sound changes with dynamic level.
ppp
fff
| Harmonic | ppp | fff |
|---|---|---|
| 1 | -30.5 | -24.2 |
| 2 | -54.2 | -18.6 |
| 3 | -49.3 | -22.6 |
| 4 | -67.7 | -26.7 |
| 5 | -57.6 | -29.1 |
| 6 | -67.8 | -43.3 |
| 7 | -81.6 | -46.4 |
| 8 | -87.3 | -43.4 |
Notes on the frequency analysis
The frequency analysis was performed in Audacity using a Hanning window and an FFT of 4096 samples to show clear, discrete peaks for the harmonics.
The frequency scale on the graphs is logarithmic.